Tight Inventory Leads to Slow First Half
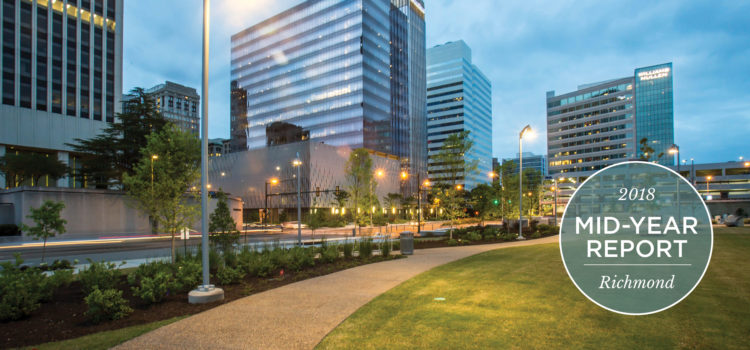
July 1 marks the mid year point each year, and in Richmond that coincides with many vacations and a more relaxed time of the year for many locals. We celebrate with our many festivals around the City and take time out to spend in the fantastic parks throughout the area. But for real estate, it isn’t a time to slow down, it’s a time when we work diligently to help our clients complete the home sale process, and begin planning for the Fall. It’s also the time when we release our 2018 Richmond Mid-Year Market Report.
QUICK TAKEAWAYS
- This past six months has been anything but slow and relaxing in the real estate market. We’ve watched as inventory growth lagged behind sales yet again, and dragged the average days on market across the region to a crazy low 33 days. While asking prices increased by just over 3.75% for the same time last year, sale prices rose by nearly 4.25% displaying increased competition among buyers. Inventory was 20% lower than just 2 years ago. But all of this happened without any real growth in actual sales — up a total of 4 homes across all five counties to 8,072 home sales.
- Time on market is always a great indicator of how a market is performing, and 2018 has been no exception. Of the homes that have sold this year, 43% of them, more than 3,400 homes, were listed for less than 7 days before going under contract. That is an extraordinary number. Two years ago, in 2016, that number was 33%. And just five years ago, in 2013, it was a mere 19% of homes that sold that fast. The homes that resisted fast sales tended to be homes with overly optimistic sellers on aggressive pricing, or a few pockets of geography where sales were not as strong. Goochland County, our smallest number of sales each year, had the highest average Days on Market, which was only 52—still a very short period of time, historically speaking.
- New Construction in Richmond is dominated by several large players, and these names are familiar to most in the industry. HHHunt, Ryan Homes, Eagle Construction, and Main Street Homes have each delivered more than 50 homes already in 2018, and HHHunt boasts roughly 150 in the first six months. The Richmond MLS makes this difficult to track, but several items stand out. More new homes are being built in Chesterfield (45% of the total market) than any other county, a trend that has withstood the test of many years. However, between Henrico (#2 locally in terms of new homes sold) and Chesterfield, Henrico boasts smaller homes for higher prices, averaging nearly $20,000 price premiums to Chesterfield. The homes in Henrico are also more than 200 square feet smaller on average. Chesterfield is by far and away the most home for the buck in our area.
As we look toward the next six months, we are watching interest rates most closely. While the market may be used to rates below 4.000% for 30 year mortgages, we are unlikely to see them again for many many years, if ever. 30 year fixed mortgages are now over 4.500% and climbing. Buyers will need to carefully balance timing and prices, and sellers are wise to keep an eye on a slowing market. Markets do cool down, and we are seeing this in pockets already.
Be sure to check out the full 2018 Richmond Mid-Year Market Report here for more info on how the market performed.
Have questions? Contact your Nest Broker today!