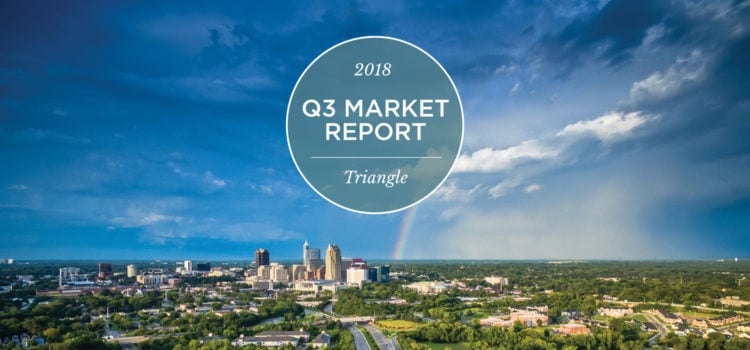
Fall has finally arrived in the Triangle and the third quarter is behind us. We’re excited to share the Q3 Nest Market Report for the Triangle.
The Triangle Market as a whole continued to boast healthy numbers across the board in the third quarter of 2018. On the national level, some industry insiders are starting to wonder if we face an oncoming downturn in the next couple of years. The Triangle’s market data, as usual, shows no signs of slowing down. Our market has enjoyed strong demand for housing while also remaining insulated from outside economic influences. This can be attributed to four major universities, two major teaching hospitals, the Research Triangle Park and downtown Raleigh and Durham.

The name of our song continues to be “Low Inventory” although Chapel Hill and Cary have seen an increase in the number of months of available inventory. Those particular areas have benefited from significant new construction development that has slightly outpaced demand. On average, each municipality in the Triangle Market saw a $20,000 increase in median sales price compared to this time last year which represents a 6.6% increase; outstanding for our market.

We continue to see a strong demand for quality housing options in prime central areas. We’ll continue to see high appreciation values as the footprint of the Triangle continues to spread outward into the far reaching corners of each of the counties. With our population still projected to grow by dozens of percentage points over the next several decades, our future is bright.
QUICK TAKEAWAYS
Raleigh
- Total sales were down 5% with 2,404 total sales this past quarter, compared to 2,538 in Q3 2017.
- Median sales price rose to $270,000 in Q3 2018, up from $248,105 in Q3 2017.
Durham
- The median sales price in Durham is $42,500 lower than the rest of the Triangle.
- Total inventory levels were down 6% compared to the end of Q3 2017 resulting in under two months of inventory available. These conditions strongly favor sellers and put upward pressure on prices.
- Average days on market this past quarter was just 14 days which is 30% faster than the rest of the Triangle market.
Cary
- Inventory levels in the Cary market have slightly expanded due to new construction, but even so, there was just 2.70 months of inventory available at the end of the quarter.
- There was a noticeable shift in the single family market compared to recent years as a result of the townhouse segment providing a more affordable alternative to single family units.
- The median sales price increased significantly across all property type categories rising more than 7%, 11%, and 25% for single family, attached, and condos respectively.
Chapel Hill
- With 4.6 months of inventory available at the end of the past quarter, there is much more supply in Chapel Hill compared to the rest of the Triangle market.
- Even though average days on market is down significantly from Q3 2017 to 40 days, it is still double the average for the Triangle as a whole, which shows just how fast homes in certain areas of the Triangle market are being sold.
- Total sales were up 4% year-over-year this past quarter bolstered by the more than 6% growth within the single family category.
Questions about this report, or the real estate market in general? Please reach out to your Nest Broker, and we’d be happy to chat!
