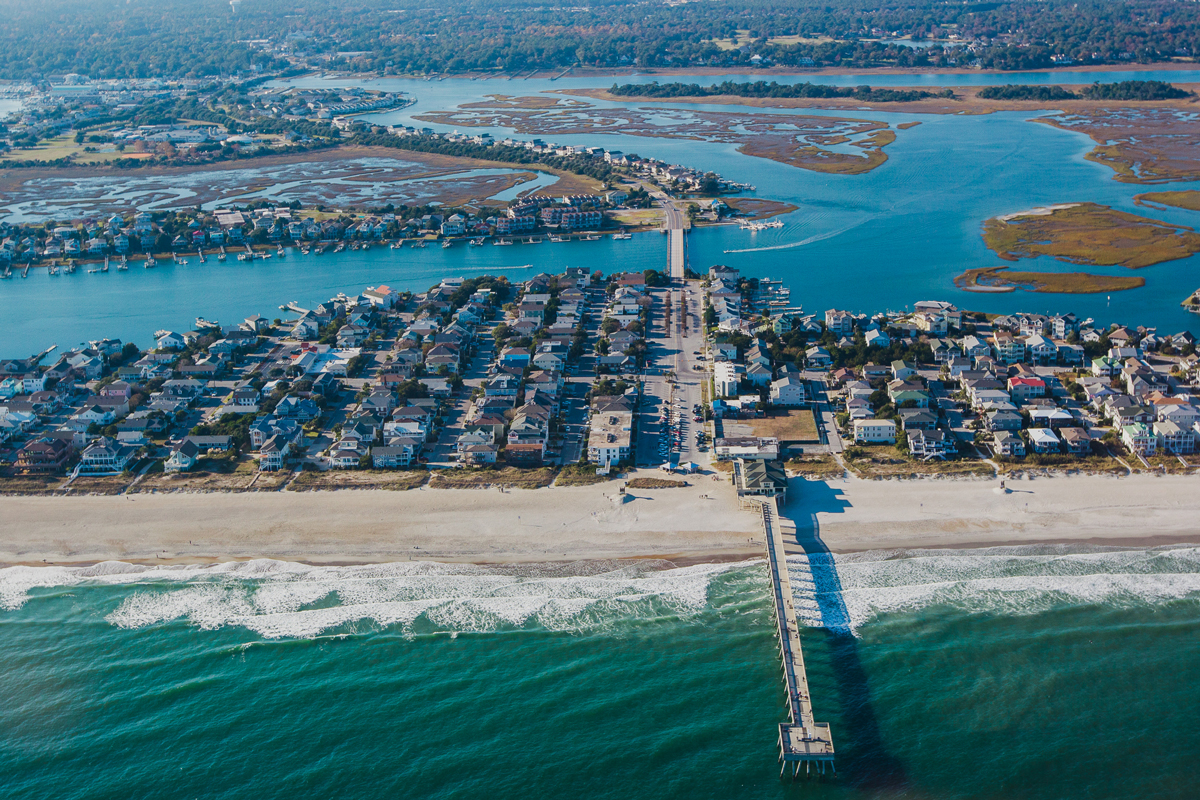
Fall is finally here and the third quarter of 2018 is in the rearview mirror. We are excited to release the Q3 2018 Wilmington Nest Report.
Market trends this past quarter were consistent with what we experienced in the first half of 2018. Depressed inventory levels continue to be the biggest factor impacting the market. Inventory levels declined year-over-year throughout our region, leading to some of the lowest levels we’ve seen in recent years. With approximately 9.13 months of inventory available at the end of the quarter, current market conditions are strongly in favor of sellers. Lack of homes for sale is not an isolated issue in our marketplace, though.

While there were likely some terminations due to home damage caused by Hurricane Florence, and new inventory being pushed into October, we’ve found that things (for the most part) are back on track. Continue reading for highlights of the third quarter performance.

Wilmington MSA
- As one would expect, our local real estate market felt the effects of Hurricane Florence as there was little to no activity in the second half of September, resulting in significantly fewer sales, fewer contracts, and fewer new listings than we’ve seen in the third quarter of recent years.
- Total sales dropped 9% year-over-year in conjunction with a 19% decline in inventory levels since Q3 2017. The decrease in inventory contributed to the drop in sales in addition to the effects of the hurricane.
- On the whole, median sales prices continued the steady upward trend we’ve experienced now for the last few years, rising 4.5% in the single family category.
New Hanover County
- New Hanover County actually experienced the smallest drop in total sales this past quarter at 7% year-over-year.
- The drastic decline in new listings hitting the market last month could impact activity in the fourth quarter as inventory is down 21% from the end of Q3 2017 as a result.
- All property type categories saw a significant decrease in average days on market, except single family, which stayed the same as Q3 2017 at 58 days.
Pender County
- Market trends in Pender County are consistent with those experienced throughout the greater Wilmington area with total sales and inventory both declining 15% year-over-year.
- The average price per square foot of single family homes increased significantly jumping more than 14% compared to Q3 2017, which is a positive trend for home owners.
- Another positive sign for sellers this past quarter was the decrease in average days on market in every property type category, dropping to 74 days on average.
Brunswick County
- Brunswick County experienced the most significant year-over-year decrease in total sales this past quarter with single family, attached, and condos dropping more than 15%, 27%, and 13% respectively.
- Even though total sales were down this past quarter compared to Q3 2017, the 1,057 sales this past quarter were the second highest Q3 total in the last five years.
- The single family property type category experienced the largest increase in median sales price at 6.5% year-over-year.
Be sure to read the full Q3 2018 Wilmington Nest Report.
Questions about this report, or the real estate market in general? Please reach out to your Nest Broker, and we’d be happy to chat!
