
2019 is now over and we are excited to release our 2019 New River Valley Annual Report. Understanding what’s going on in the market allows us to equip our clients to make confident, informed decisions. It also gives us an idea of what the future holds.
The question we likely get asked more than any is “How’s the market?” Seems that, like asking a meteorologist “Is it going to rain tomorrow,” it’s the one thing everyone wants to know of Realtors. And we ask in return, “What have you heard?”
Ask anyone in our office “how’s the market” and they’ll all tell you that inventory is tight. Hands down, this is one of the tightest home-buying markets in some time, and that’s been a frustrating position for many people. Interest rates have remained historically low, even trending lower a bit, and that puts continued pressure on homeowners who, rather than selling and moving into something a bit more well-suited, are staying put and remodeling, refinancing, or both. In fact, our lender partners are reporting that refinances nationwide are at some of their highest levels in quite some time.

What has been a tough market for buyers in 2019 could be seen as a great market for sellers. Lower number of available homes for sale has often meant greater demand, even in some areas of the New River Valley that have historically lagged behind traditional market trends. However, the rapid pace of the market has created some issues around appraisals, and with loans not being approved because market prices have increased so dramatically.
2019 has been an interesting year, to say the least. Our goal continues to be to educate, in whatever market you’re in, so that you can #MoveBOLDLY.
Quick Takeaways
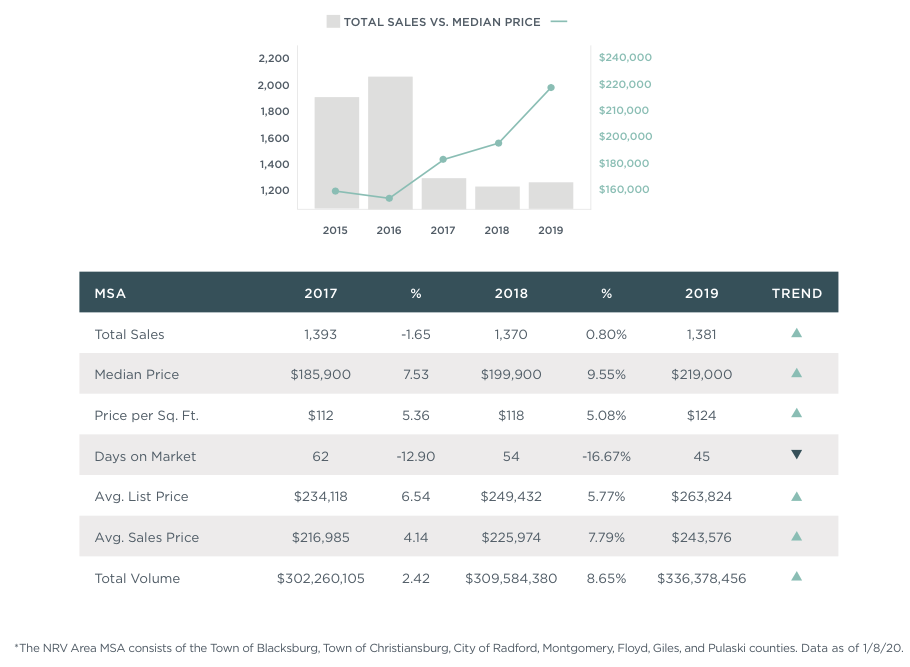
- Total sales increased less than 1% year-over-year across the New River Valley MSA last year. Total sales were 1,381, a 0.80% increase from 2018, when there were 1,370 total sales.
- The median sales price in 2019 was $219,000, a 9.55% increase over 2018’s median sales price of $199,900.
- In the New River Valley MSA, average days on market dropped 16.67% to 45. The Town of Blacksburg had the lowest average days on market within the New River Valley MSA at 32 days.
Be sure to check out the full 2019 New River Valley Annual Report here for more info on how the market performed last year. Have questions? Contact your Nest Broker today to find out what this report means for you and to discuss your real estate goals. Interested in what’s happening in other markets? Check out all our 2019 Annual Reports here.