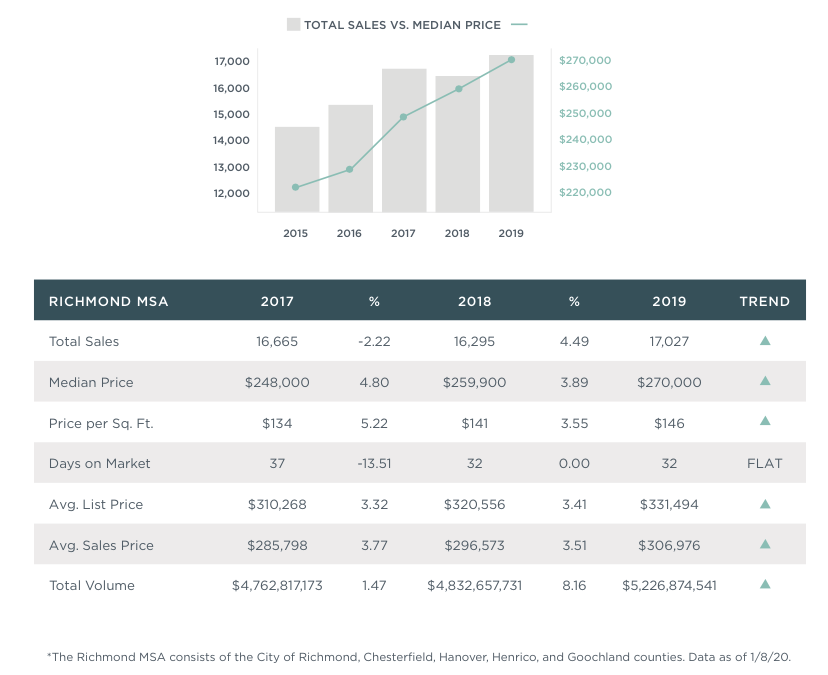
2019 is now over and we are excited to release our 2019 Richmond Annual Report. Understanding what’s going on in the market allows us to equip our clients to make confident, informed decisions. It also gives us an idea of what the future holds.
We’re excited to finalize the 2019 Richmond Nest Annual Report and get it out to you. This is our fourth year publishing this study in the Richmond market, and it continues to be enlightening to us to review the information and dig deeper into the meaning of these numbers. If you have questions regarding the report or how it relates to your home and your plans, just reach out to a Nester here in Richmond, and we promise to be here to help.
There are years that are better for buyers and years that are better for sellers. 2109 was an interesting one, as sellers found an ample supply of ready, willing, and able buyers, and buyers, when they could secure a contract, found a financial market with extremely low interest rates and price increases that quickly brought equity to many new homeowners in short order.

Across the larger Richmond area, only one county, Goochland, saw a reduction in Median Price during 2019. But even there, the Average Price paid Per Square Foot was up, indicating that the Median Price shift was more a matter of size of homes sold than actual value shift. The same was true of all 19 areas. Not one area suffered a drop in price per square foot over the last year.
And while price increases are good for home owners, they can also limit the number of future buyers, or cause a drop in sales. But in 2019, the number of sales increased in the City and all four surrounding counties in our MSA, indicating the current economic conditions are supporting a continued surge in sales.
We’ll be watching 2020 to see if more homes become available for sale this year. We are beginning to see very slight increase in Days on Market in the higher price points, but even there, the availability of homes is not sufficient for a balanced market.

Quick Takeaways
- Total sales increased more than 4% year-over-year across the Richmond MSA last year. Total sales were 17,027, a 4.49% increase from 2018, when there were 16,295 total sales.
- The median sales price in 2019 was $270,000, a 3.89% increase over 2018’s median sales price of $259,900.
- In the Richmond MSA, average days on market stayed flat at 32. Bon Air and North Chesterfield had the lowest average days on market within the Richmond MSA at 21 days each.
Be sure to check out the full 2019 Richmond Annual Report here for more info on how the market performed last year. Have questions? Contact your Nest Broker today to find out what this report means for you and to discuss your real estate goals. Interested in what’s happening in other markets? Check out all our 2019 Annual Reports here.
