
2019 is now over and we are excited to release our 2019 Wilmington Annual Report. Understanding what’s going on in the market allows us to equip our clients to make confident, informed decisions. It also gives us an idea of what the future holds.
2019 seems to have come and gone in the blink of an eye, and poof, we’re through January already! While everyone is busy trying to follow through on their resolutions and getting their year set up, at Nest, we’re busy answering one huge question: “How’s the market?” As real estate Brokers we hear this question quite often, and while it seems it would be simple to answer, it’s actually pretty complex. Providing our clients with the best insight to make confident and informed decisions is one of the most important parts of our jobs. In order to do this we analyze vast amounts of market data and deliver it in a relatable fashion.

Our 2019 Wilmington Annual Report provides a comprehensive look into how our local market performed not only last year, but in years past as well. Whether you’re considering selling your current home, buying a home, or you’re just interested in learning more about our local real estate market—we hope this report provides the data and insight that will serve you as a valuable tool.
The Wilmington area real estate market turned in another solid performance in 2019—median sales price increased and days on the market decreased, plus unicorns invaded our central business district. It’s still a very robust sellers’ market in most price points, and our luxury market of $1 million plus has hit a new all-time record number of sales. With no signs of letting up, we expect this trend to continue until inventory catches up.
Quick Takeaways
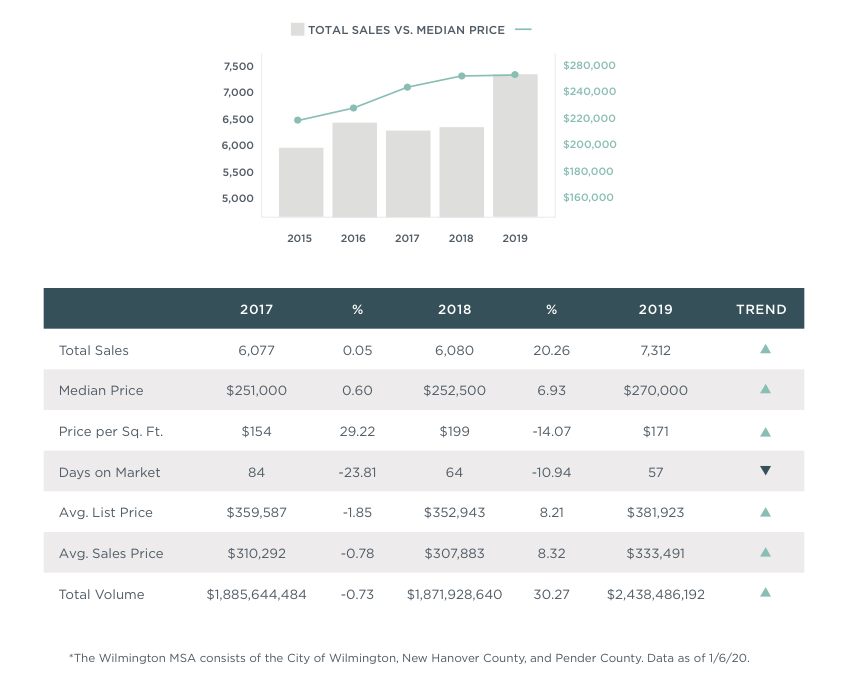
- Total sales increased more than 20% year-over-year across the Wilmington MSA last year. Total sales were 7,312, a 20.26% increase from 2018, when there were 6,080 total sales.
- The median sales price in 2019 was $270,000, a 6.93% increase over 2018’s median sales price of $252,500.
- In the Wilmington MSA, average days on market dropped 10.94% to 57. The Sunset Park neighborhood had the lowest average days on market within the Wilmington MSA at 33 days.
Be sure to check out the full 2019 Wilmington Annual Report here for more info on how the market performed last year. Have questions? Contact your Nest Broker today to find out what this report means for you and to discuss your real estate goals. Interested in what’s happening in other markets? Check out all our 2019 Annual Reports here.