It’s no secret that at Nest Realty, we dig data. So much that we’ve pored through market and real estate numbers for the year thus far to pull out and share bite-sized data points with you. In this 2021 Raleigh-Durham-Chapel Hill Mid-Year Market Report, we present a snapshot of current conditions. We focus on local insights that pertain to you, so that if you decide to buy or sell, you can make confident, informed decisions.
Highlights:
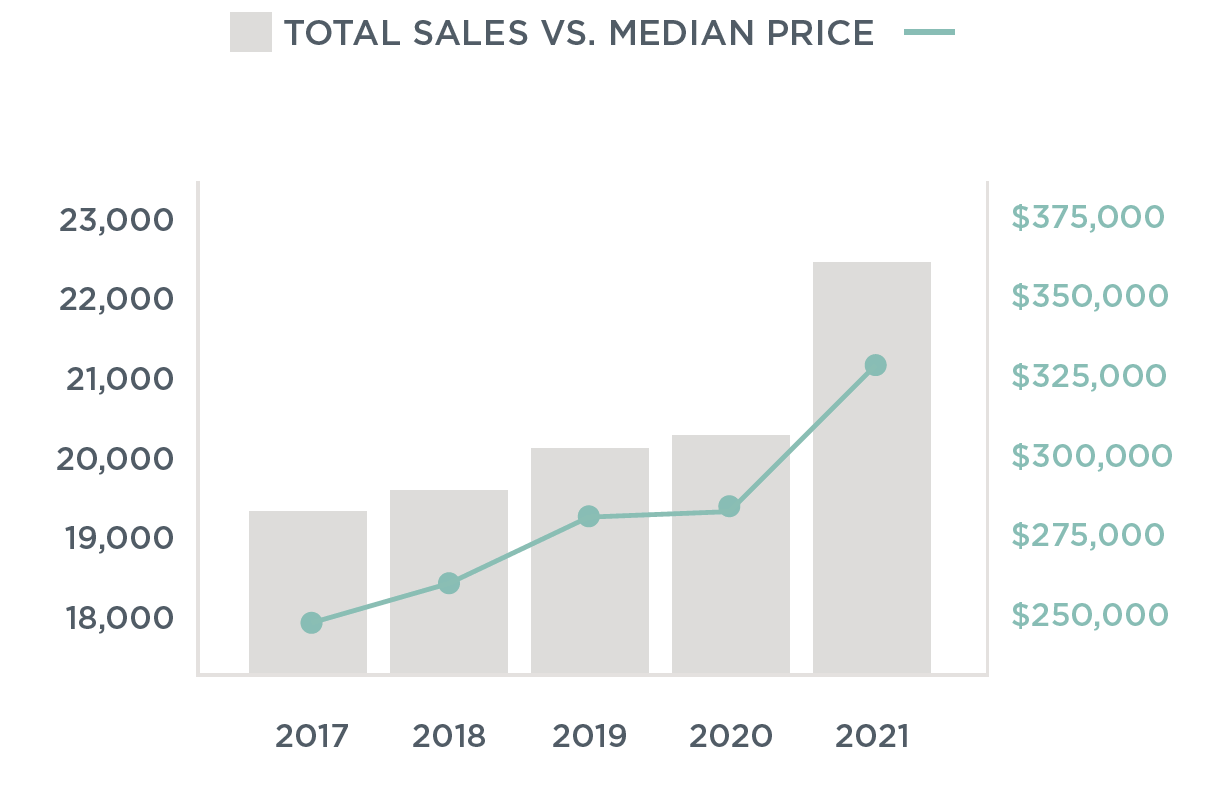
- There were 22,840 total home sales in the Raleigh-Durham-Chapel Hill area in the first half of 2021 compared to 20,413 in 2020. This translates to an 11.89% increase.
- From Q2 2020 to Q2 2021 the average sales price increased by 16.80%. In 2021 the average sales price was $381,718 compared to $326,807 in 2020.
- So far in 2021 on average a listing stayed on the market for 15 days before closing. The average price per square foot was $171.
Click here to read the full 2021 Raleigh-Durham-Chapel Hill Mid-Year Market Report.
Eager to learn more? Our Nest Brokers would love to chat about current market conditions and how we can help you achieve your real estate goals.