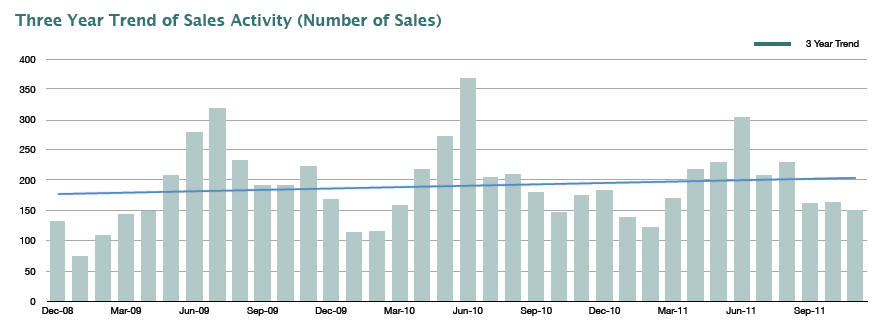
Overall, the November 2011real estate market in Charlottesville performed about as we expected. Overall, total year-over-year sales were down (from 174 to 150). Median sales prices in the Charlottesville MSA were also down…by about 3% from November 2010.
There was some positive news, though: the three-year total sales trend is now slightly positive…meaning that sales in recent months are trending higher than what we’ve seen, on average, over the last 3 years.
From the report…
Regional year-over-year total sales dropped in November as compared to 2010. Total sales over the last 12 calendar months (2279) are relatively flat to the prior 12 month period (2327). That, in and of itself, is a victory in today’s market. Overall median prices in November did drop about 3% from November 2010. Days on Market for sold properties has remained relatively steady over the last 12 months – typically hovering in the 100 to 120 day range. Inventory levels for the entire MSA increased from 14.81 in November 2010 to 16.84 months. While total inventory levels did drop slightly, the drop from 174 to 150 total sales forced the Months of Inventory up approximately 15%.
Even with the drop in sales during November, the three-year sales trend is now slightly positive in Central Virginia. Total sales in all six areas dropped as compared to last November. Notably, Albemarle County sales dipped from 73 to 69 and Charlottesville City sales fell from 21 to 20. In addition, contracts written in Albemarle fell from 94 in 2010 to 75 this past month. Charlottesville City contracts increased from 25 to 26. On a positive note, condos and attached home sales in the MSA increased 40% year-over-year and Months of Inventory fell 21% to 12.97 months.