We are diligently working on our Q3 report. But we will not have that ready until early next week. Until then, we thought we would feed you a little teaser to show you what we are up to.
All stats in real estate are either about sales or leading to sales. You can track actual property transfer trends, or you can watch new contracts written, or pending. But there is one other valuable number: Lockboxes. Just as tracking new contracts written can predict the number of sales in the next 60 days, the number of lockboxes opened can predict the number of contracts that will be written.
In the Charlottesville MLS, as in many areas of the country, our listings are protected by a computerized lockbox system. In order for any agent to enter one of my listings, they must use a personalized computer key to access the key for the house. That info then gets sent back to me as a listing agent, and thus I know how often my listing is being shown, and by whom. There are some limitations, but in general, the system works really well.
Enter Nest Realty. For over a year now, we have been accessing the entire MLS lockbox data and trending that info. We don’t have access to what houses are being shown, nor in what areas of the MSA. The only thing we know is that in the last 7 days, there were 1318 lockboxes that were opened in the entire MLS. Compare that to a year ago when 1455 were opened, and we can start to see that there are 9.4% fewer homes being looked at than a year ago.
But certainly one week does not tell the whole story. Let’s look at the year since January 1. Internally, we predicted that 2011 would be far below 2010 in the first quarter for showings, and we were right. The basis for this hypothesis was that during 2010, the Homebuyer Tax Credit was in place and thus showings and sales were higher than the true market. We weren’t too worried about it. Our belief was that as soon as we got to comparing May numbers, we would likely see growth against 2010. Check out this small subset of the graph.
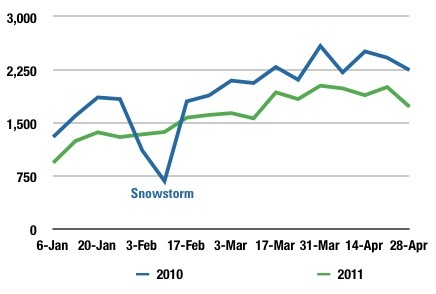 The Blue line is 2010 and the Green is 2011. As I stated above, the 2011 numbers are below 2010 except for the week of the great snowstorm of 2010. In fact, the numbers vary anywhere from 12 % to 29% lower in 2011. But, we kept looking at the tax credit and saying, 2010 had an anomaly of showings in Q1. What really matters is Q2. And with Q2, we again saw exactly what we expected… at least for the first few weeks.
As soon as the tax credit expired in ’10, the showings dropped off significantly. And the 2011 numbers started looking better. As long as we kept pace and stayed over the 2010 numbers, we would clearly be indicating some form of leveling at worse or a recovery at best. But… as much as we’d like to stand up and say its all over, this just isn’t what we are seeing.
Next you see the period of 2011 SINCE the April 30 period. Please NOTE: I have changed the scale on the two graphs. There is not nearly as much variability in the second chart. 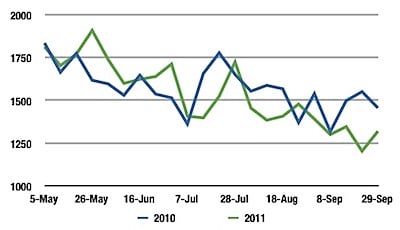
Between May 5 and July 15, there was only one period where 2010 had more showings than 2011. This is what we expected… What we didn’t expect was the period after July 15. Since July 15, there have only been 2 weeks where the 2011 numbers were better than 2010. There has just been a giant stall across the market. We had several weeks in April 2011 where we had more than 2000 showings a week. We have not seen 1500 showings a week now since July.
So, what do the lockboxes tell us? For starters, that any real chance of stabilization this year is in question. But, things can turn on a dime in this market, and a one month uptick can make the difference between a lackluster year and a genuinely strong year.
The other interesting thing we see is just how few showings there have been. According to the CAAR data, across the entire MLS, there are more than 3500 active listings. If the showings last week were spread out evenly (which they never are) there would have been less than one showing for every two houses. (Yikes). One thing is for sure. There is little chance of selling a house that is not even being shown. If you want to sell, you very much have to be willing to price very aggressively. You need to turn heads.
———-
Keith Davis is a Partner and Associate Broker with Nest Realty Group.
K
Written on
What about a graph detailing showings per listing over the same period? Might be interesting additional color.
wkdavis
Written on
K – Funny you should suggest. We don’t have active listings by day, but we do by month. We are working on pulling the showing data by month and then combining it with inventory at the start of each month. We’ll keep you posted.