Design
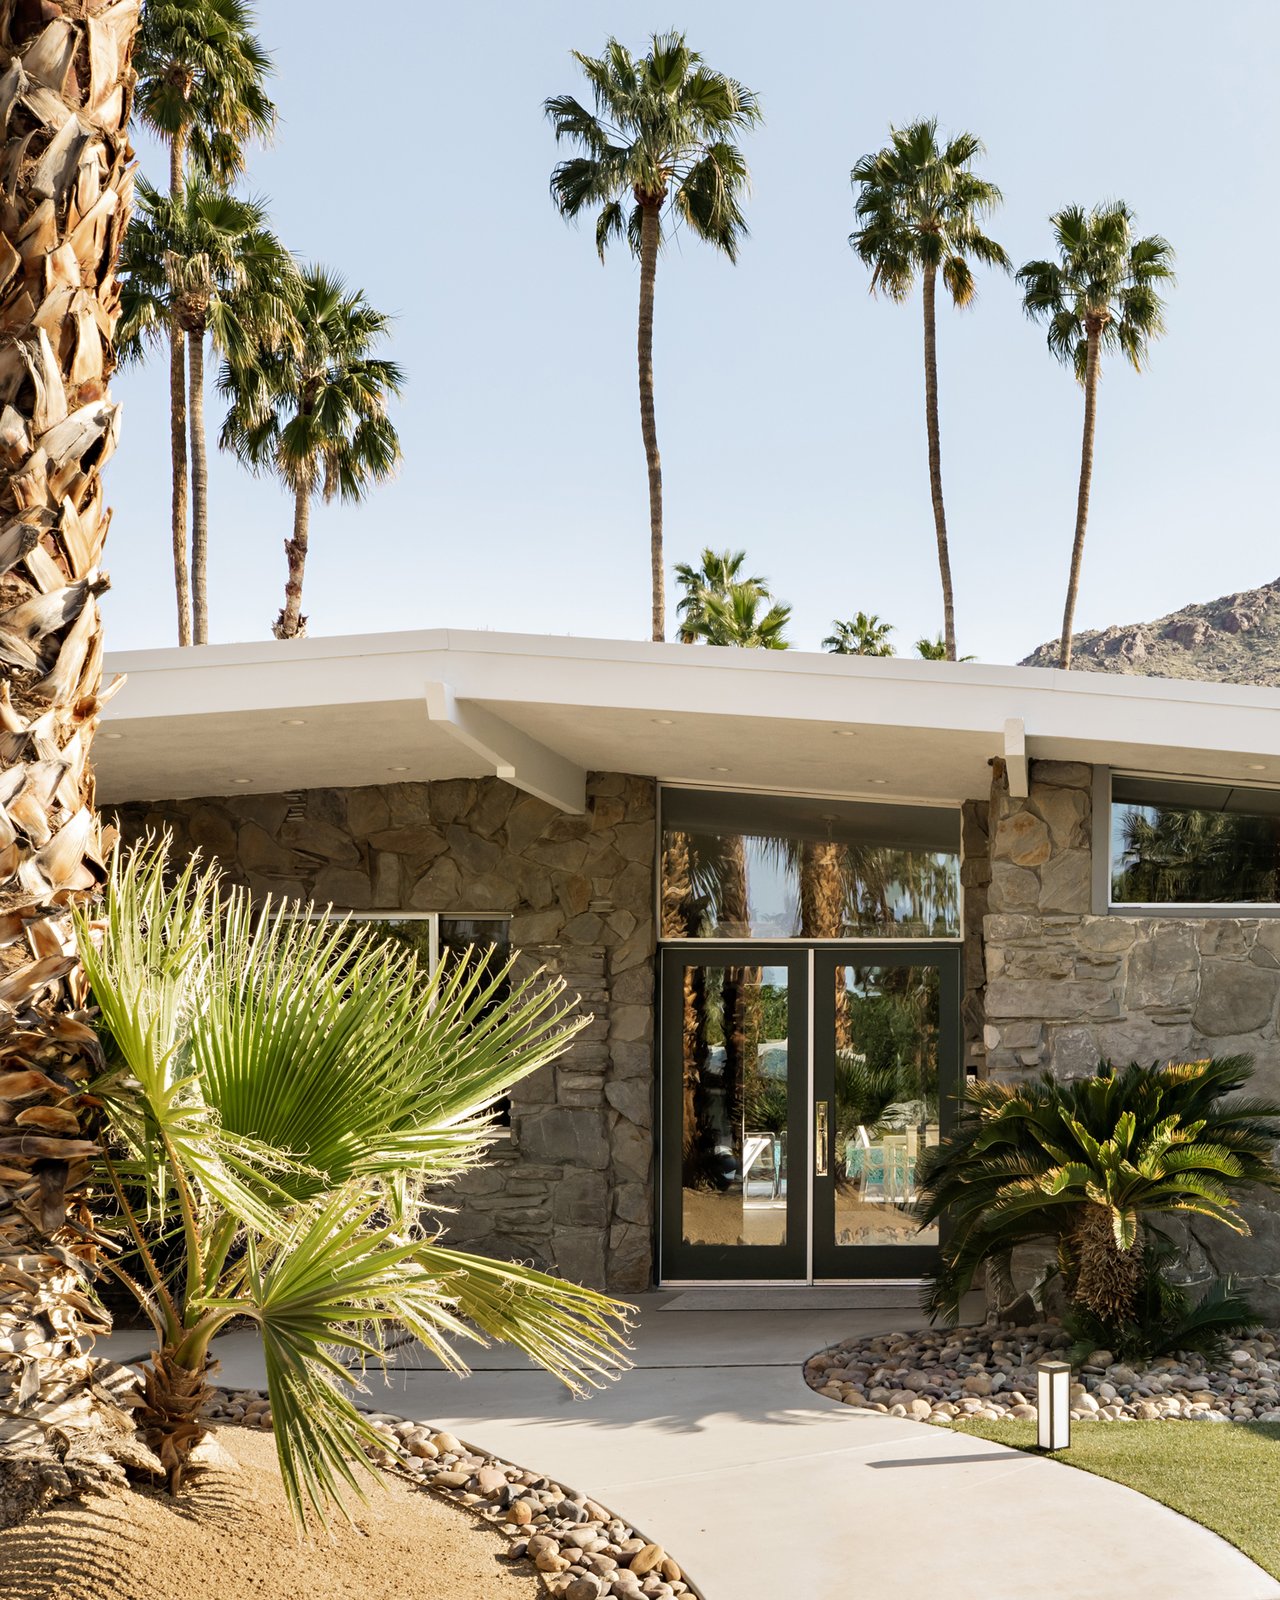
House Tour: Palm Springs Perfection
Famed interior designer Christopher Kennedy serves up chill vibes and cool sophistication at this Las Palmas home.
15 min read | September 22, 2025
Design
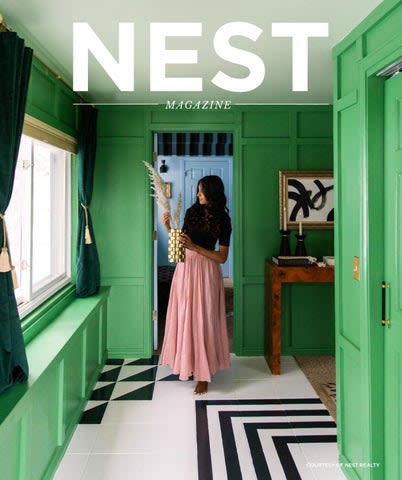
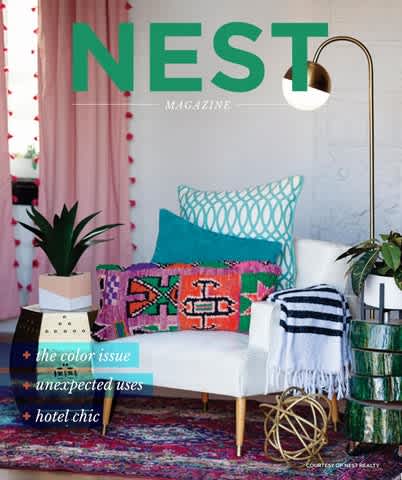
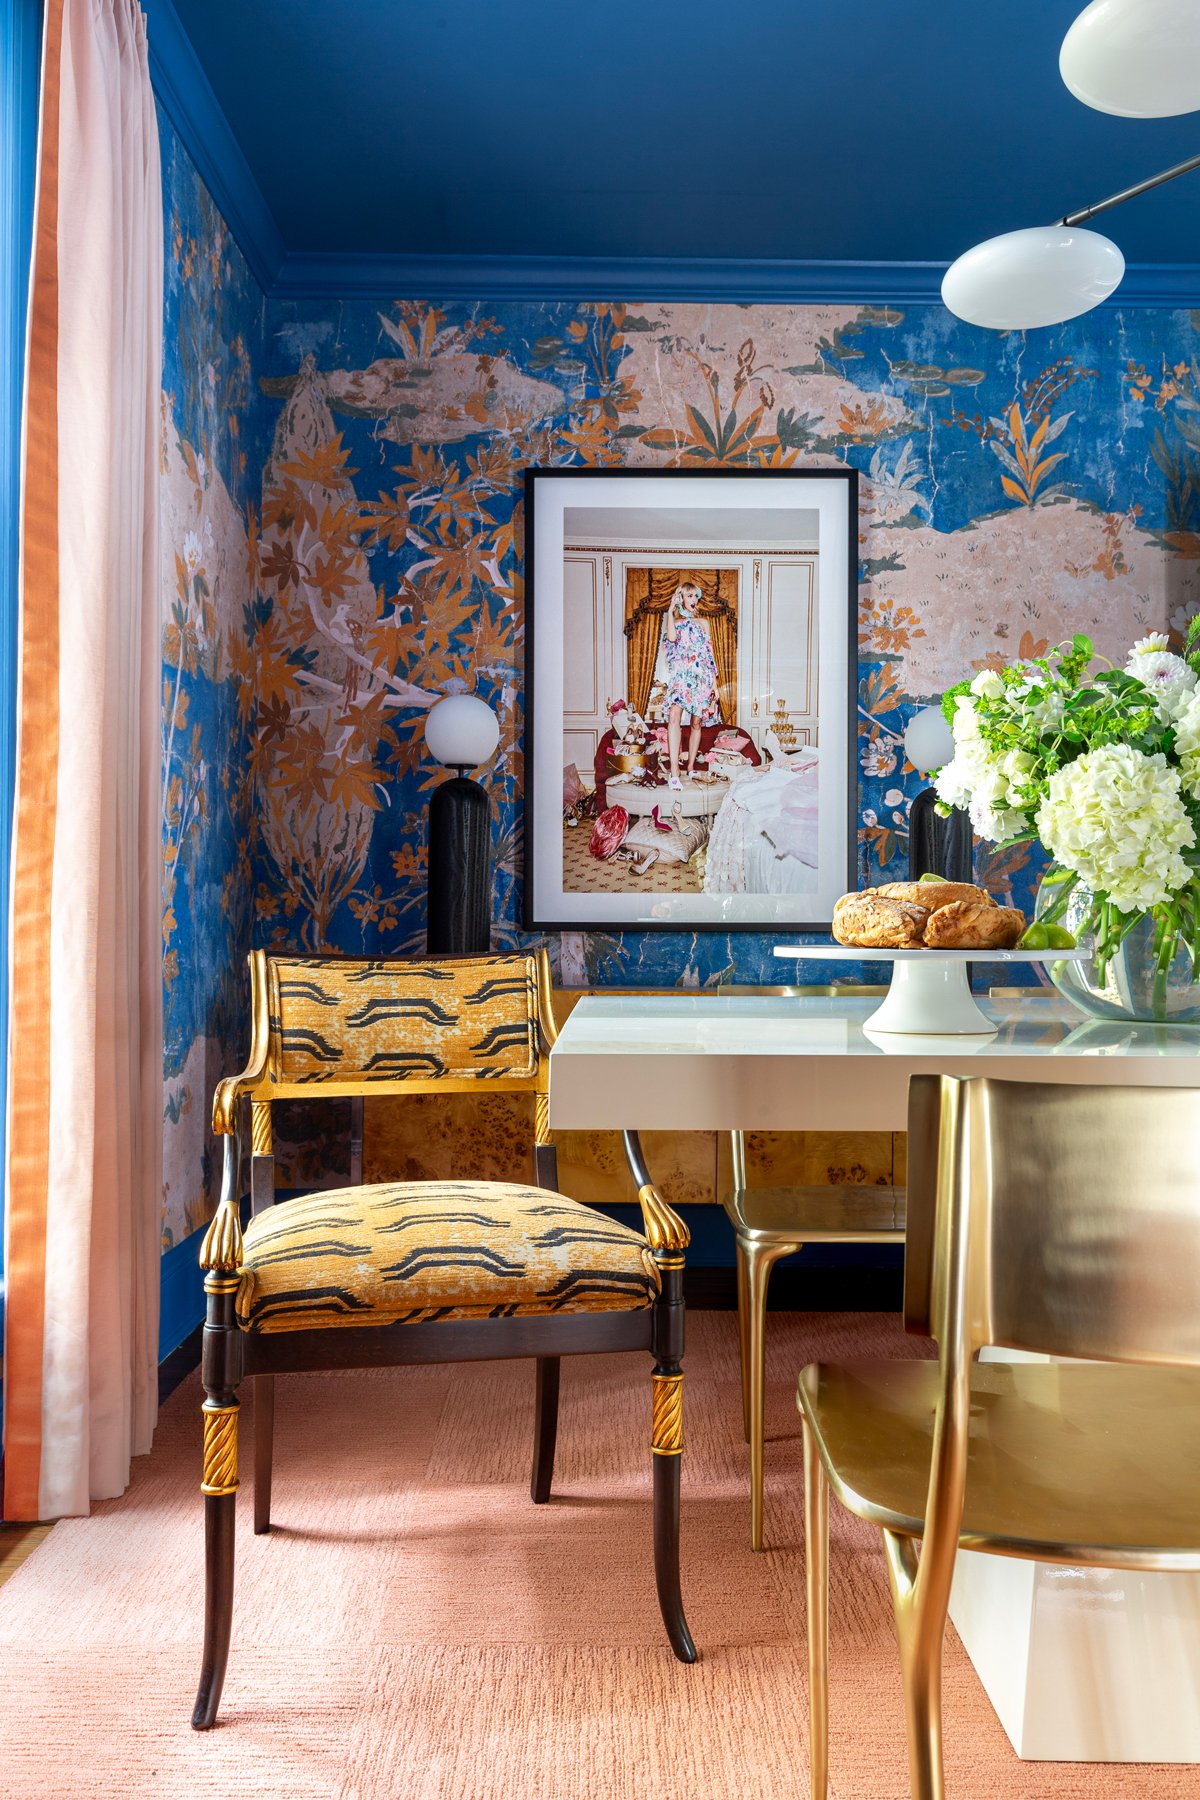
House Tour: Chromatic Glamour
When vibrant colors and bold patterns are on the wish list, a D.C. couple turns to interior designer Jewel Marlowe to revitalize their home.
15 Min Read | September 22, 2025
Design
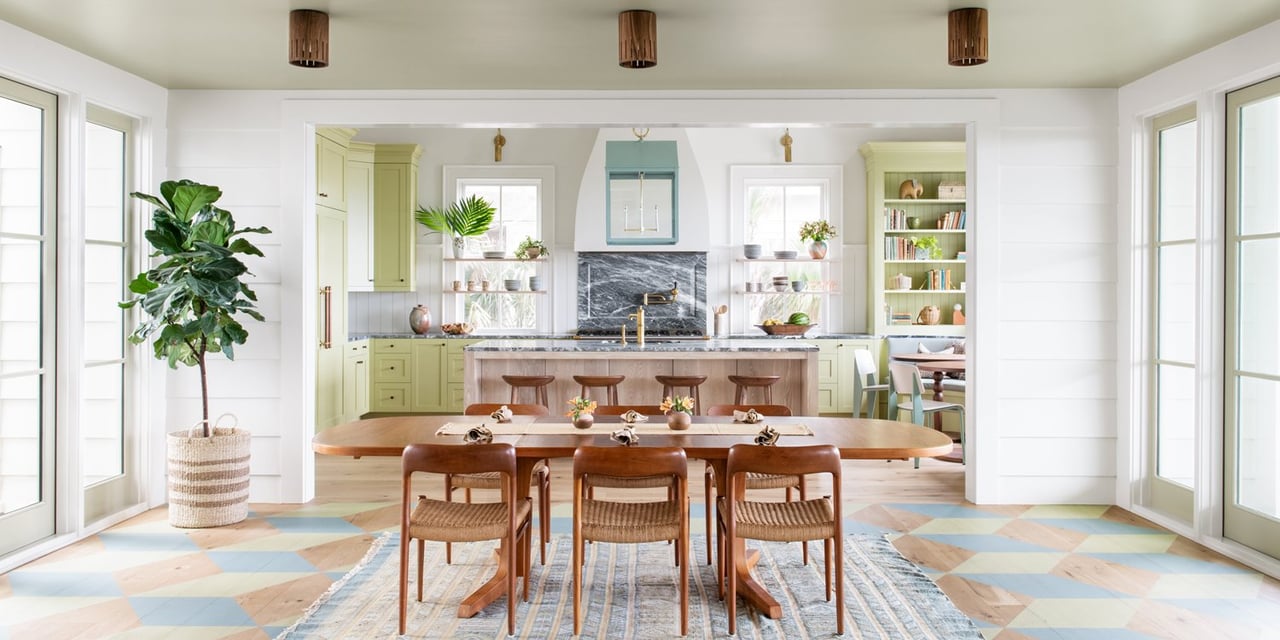
House Tour: Modern Fairy Tale
A family home on Kiawah Island, South Carolina, is brought to life.
15 Min Read | September 18, 2025