“How’s the market?”
2017 seems to have come and gone in a flash as we’re nearly three weeks into 2018 already. While everyone is busy making resolutions this time of year, at Nest, we’re busy answering one question, “How’s the market?” This is a question often posed to us as real estate Brokers and we understand the importance of providing our clients with the insight to make confident, informed decisions.
We are excited to release our 2017 Annual Report. This report provides a comprehensive look at how our local market performed not only last year, but in year’s past as well. Whether you’re considering selling your current home, buying a home, or just interested in learning more about our local real estate market, we hope this report serves as a valuable tool.
The Triangle real estate market continued it’s steady growth in 2017. Over the past five years, our market has been booming. We’ve seen significant year-over-year sales growth during this span, capped by the more than 3% growth this past year. Since 2012, total sales have increased an astonishing 57%. Not only have total sales been on the rise, but prices have steadily increased during this span as well. Median and average sales prices throughout the Triangle increased by more than 7% compared to 2016.
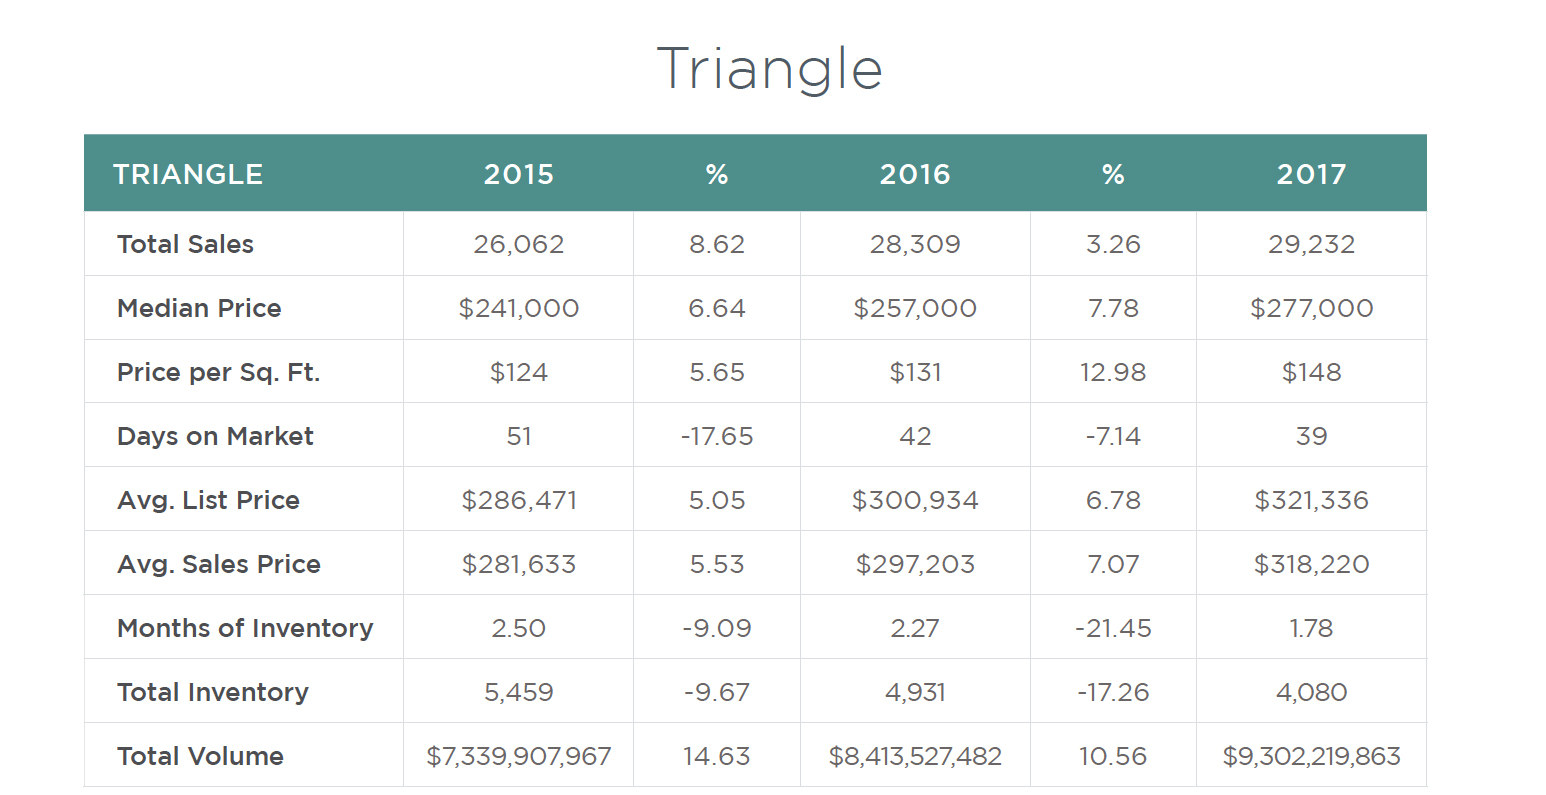
The one trend in our market of potential concern is the declining inventory trend. Inventory levels are the lowest they’ve been in recent years. At the end of 2017, there was slightly less than two months of inventory available in the Triangle. These conditions are the primary reason sales prices increased so significantly this past year. With six months of inventory considered to be a sign of a balanced market, current conditions strongly favor sellers. The growth we’ve been experiencing is unsustainable without an influx of inventory as prices will continue to rise, likely forcing some buyers out of the market. The inventory environment will be one we monitor closely in 2018.
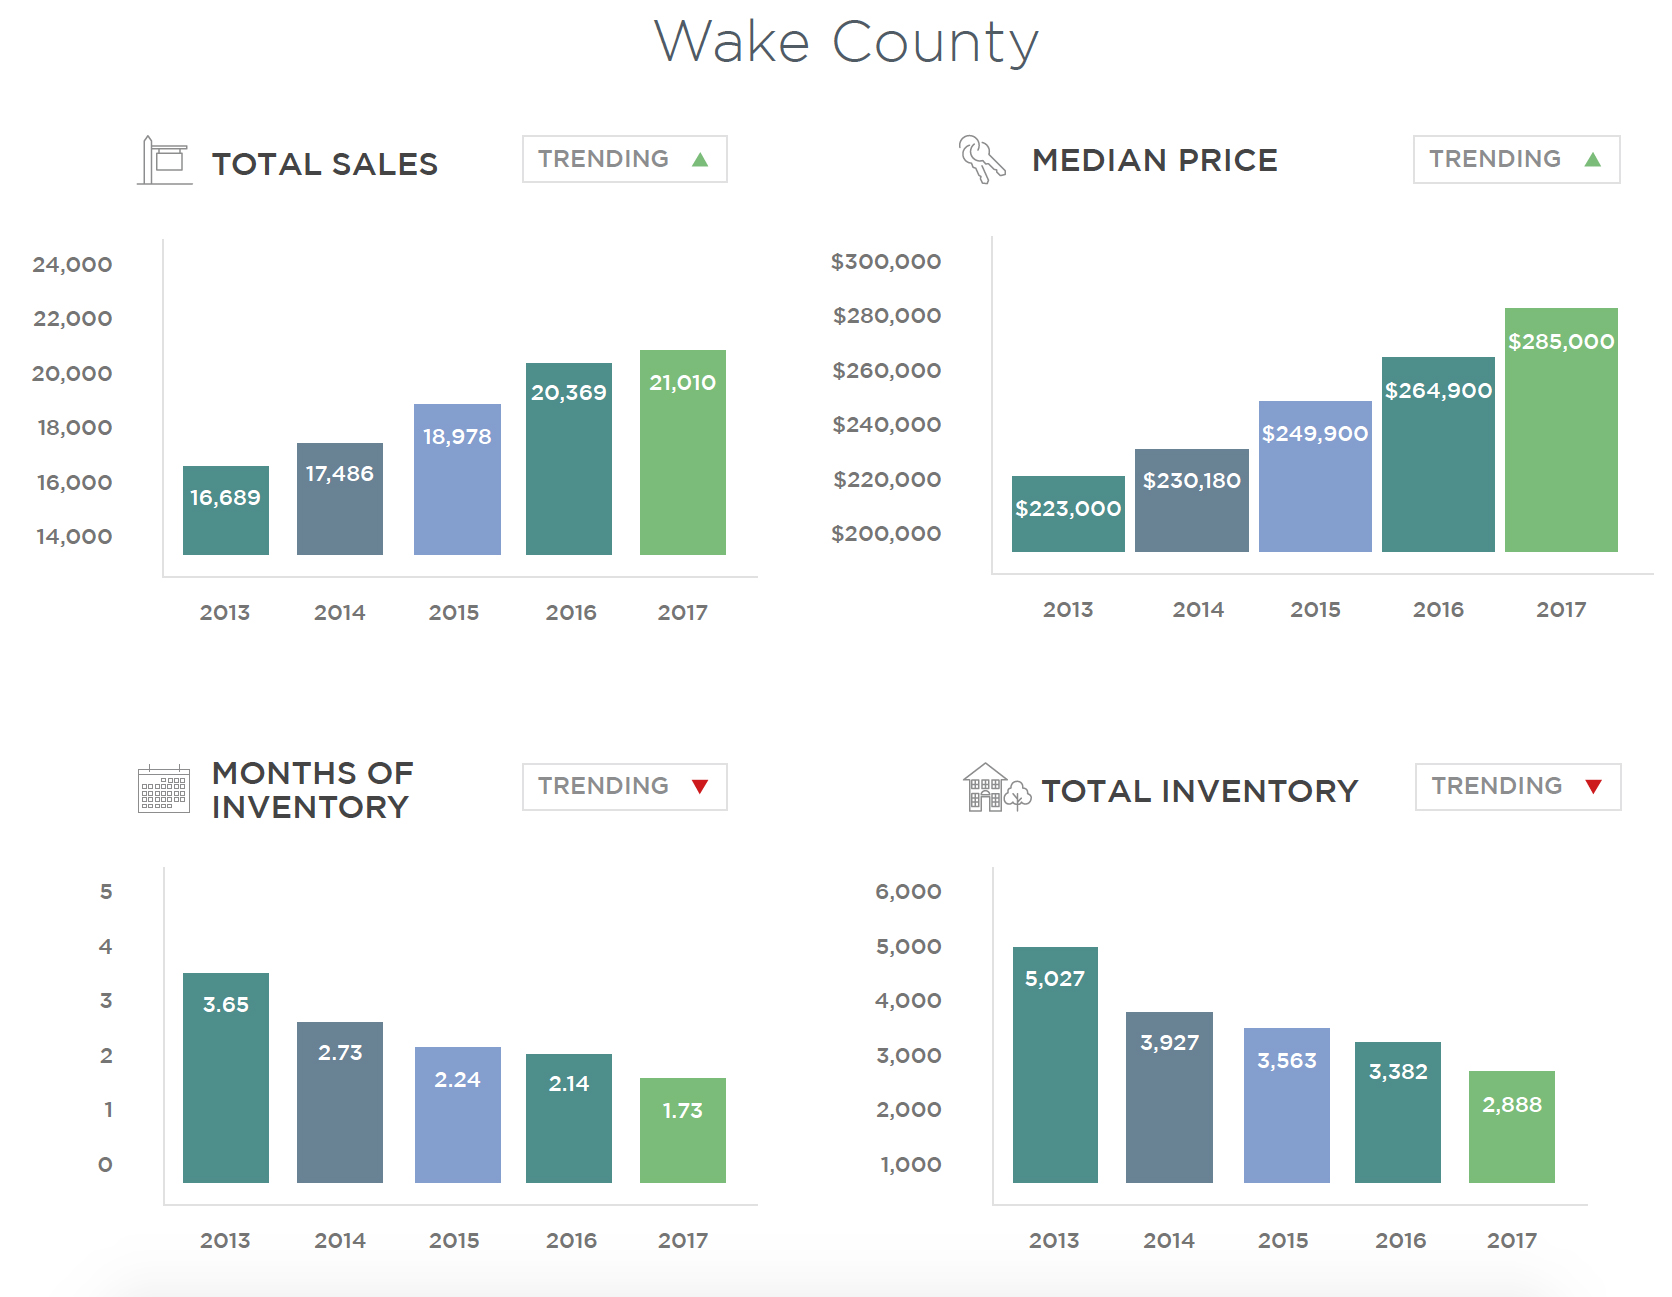
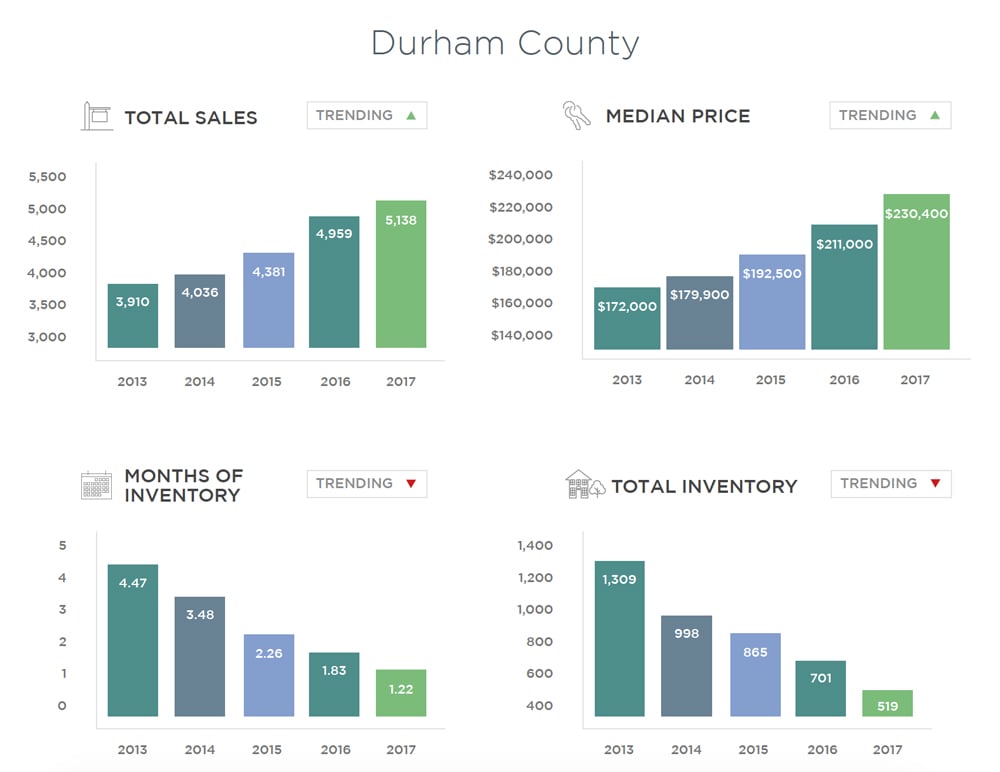
Total sales performance in Wake and Durham counties mirrored that of the Triangle as a whole, each witnessing a year-over-year increase of slightly more than 3%.
While Orange County saw total sales dip slightly in 2017 compared to 2016, Chatham County saw a significant uptick in sales, rising 13% year-over-year. While Inside the Beltline had the smallest growth in total sales in Raleigh, it had the largest increase in median sales price, climbing nearly 16% to $330,000. The suburban areas surrounding Raleigh experienced some of the largest sales increases in the Triangle. Sales increased nearly 19% in Garner and nearly 17% in Wendell/Knightdale. Downtown Durham continues to be the most popular section of the city with sales rising nearly 12% and median sales prices rising more than 16% this year.
Be sure to read the full 2017 New River Valley Annual Report below to learn more about how the New River Valley market performed in 2017. Have questions? Contact your Nest Broker today to find out what this report means for you and to discuss your real estate goals. We’re happy to help you Live Where You Love, and MOVE Boldly in 2018.
(We suggest viewing in fullscreen mode – click the icon at the bottom right.)