Welcome to the Richmond 2021 Annual Report. At the beginning of each year, we engulf ourselves in the data and look back at goals set — and check in on how our predictions for the past year held true. We do our best to learn from the past and prepare our clients and agents for the new year ahead.
With that, we present you with this synopsis of the national, regional, and localized trends that matter most to you, found here in our Richmond 2021 Annual Report.

We pride ourselves on our ability to find useful trends in the sales information we review every year. Over the past year, we have continued our mantra that something has to change in available resale inventory if the market is to begin to normalize. This year, we saw the very predictable impact of the lack of homes in our area. As happens in nearly every marketplace, low supply and high demand results in price increases. The Richmond market is no exception. Across our area, median prices went up in every county and every property type. This wasn’t just a factor of size or location or type; prices were up everywhere.
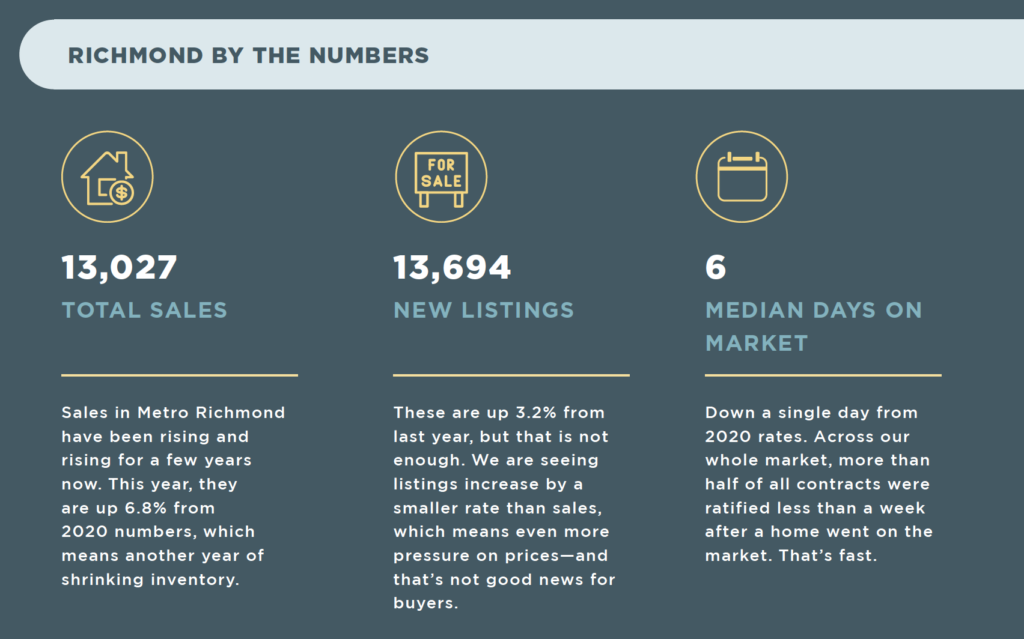
When we look at prices by size, those numbers were right in line with total price changes—in short, substantial increases. The number that surprised us the most was that the number of new listings across the Metropolitan Richmond area declined by nearly 5% (800+ fewer new listings) this year, yet that still didn’t slow sales, which increased by more than 5% market wide. Multiple offers were the norm, and look to be moving forward. Which lands us right where we were last year, looking for additional homes to come on the market and calm the anxiety that shortages have caused. Without the balance, prices will become the limiting factor in sales.