“How’s the market?”
2017 seems to have come and gone in a flash, and 2018 is quickly upon us. While everyone is busy making resolutions this time of year, at Nest, we’re busy answering one question, “How’s the market?” This is a question often posed to us as real estate Brokers, and we understand the importance of providing our clients with the insight to make confident, informed decisions.
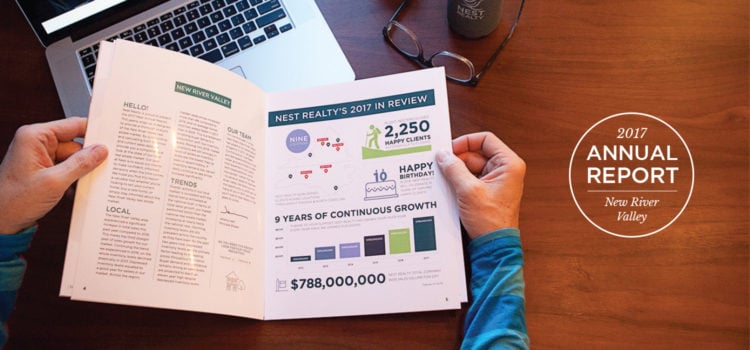
With that in mind, we are excited to release our 2017 New River Valley Annual Report. This report provides a comprehensive look at how our local market performed not only last year, but in years past, as well. Whether you’re considering selling your current home, buying a home, or just interested in learning more about our local real estate market, we hope this report serves as a valuable tool.
The New River Valley continues to perform exceptionally well. After a decline in total sales in 2014, our market has seen three straight years of significant sales growth. Over the course of these three years, total sales have increased nearly 44%. Further, after a slight dip from 2015 to 2016, median sales prices in the NRV rose by more than 4% to $168,000 this past year, which is the highest median sales price over the last five years.
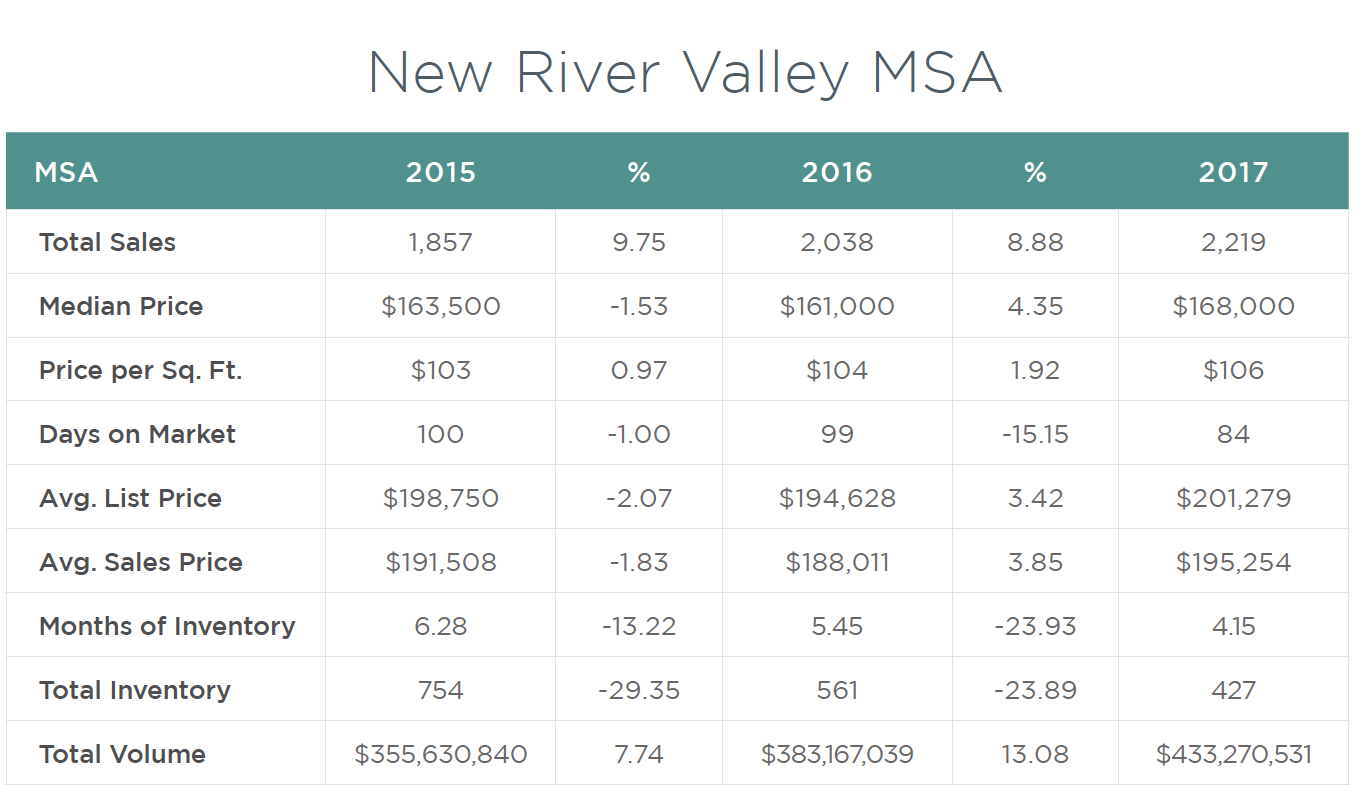
With such a significant increase, we’ve seen the inverse drop in inventory, as well. The Town of Blacksburg was the most impacted by this trend as there were just 1.4 months of inventory available at the end of the year, with lack of inventory being the main factor for slower sales growth in town. The Town of Christiansburg witnessed the largest decrease in months of inventory, falling more than 58% from 2016 to just 2.5 months at the end of 2017. These conditions strongly favor sellers and if inventory remains low, we’ll likely see prices continue to rise at a pace that’s slightly faster than the rest of the valley.
Floyd County had the largest year-over-year increase in total sales, at more than 26%.
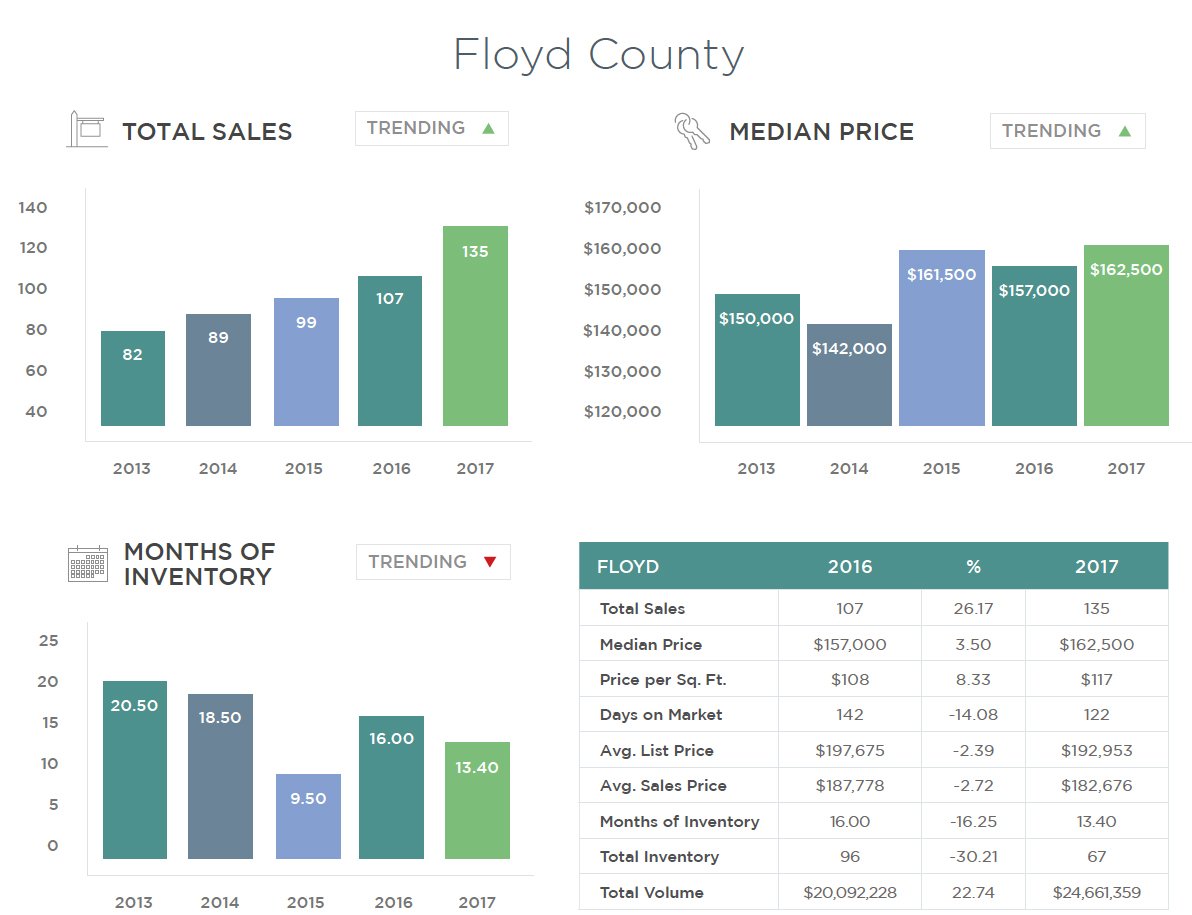
Montgomery County and the City of Radford also posted double-digit sales increases at more than 15% and 10% respectively, with Pulaski County being the only area where sales declined slightly in the last year. With the exception of Montgomery County, median sales prices rose in all counties within the New River Valley. This seems to be due to the overall inventory environment, with the Town of Blacksburg seeing the largest rise in sales prices, as both median and average sales prices rose by more than 15%.
Be sure to read the full 2017 New River Valley Annual Report below to learn more about how the New River Valley market performed in 2017. Have questions? Contact your Nest Broker today to find out what this report means for you and to discuss your real estate goals. We’re happy to help you Live Where You Love, and MOVE Boldly in 2018.
(We suggest viewing in fullscreen mode – click the icon at the bottom right.)
Jim Metropoulos
Written on
Is the 2017 New River Valley Annual Report available as a PDF download?
Jasmine Bible
Written on
Hello Jim,
Yes! We would be happy to email you the PDF if you can provide your email address. Is the @mac.com address the correct contact email for you?